Troubleshooting
This guide addresses common problems organized by observable symptoms.
First-Run Onboarding did not appear
Symptom: You installed the extension but you never saw the welcome notification for Python Behave projects.
Likely Causes: The workspace doesn't have any .feature files, it isn't recognized as a Python Behave project, or you dismissed the notification previously.
Diagnostic Steps: Ensure you have .feature files in your workspace.
Resolution: Run Gherkin PowerTools: Replay Onboarding from the Command Palette to reset the state and manually trigger the detection process.
Background Initialization Failures
Symptom: Features like Go to Definition or IntelliSense are intermittently unavailable right after opening a large workspace, and the extension output logs indicate capability initialization errors.
Likely Causes: I/O errors or heavy load caused the Symbol Cache or Workspace Graph to fail their initial startup.
Diagnostic Steps: Check the extension Output Panel. Look for logs showing a capability state as failed.
Resolution: The extension handles this automatically. The internal DeferredBootstrap supervisor detects initialization rejections and automatically schedules exponential backoff retries. Simply wait a few moments; the capability will typically recover on the next retry, and dependent capabilities (like the Workspace Graph) will safely re-initialize once the baseline caches are ready.
Formatting does not run or .feature file is not detected
Symptom: You press Shift+Alt+F and nothing happens, or the extension doesn't seem to activate.
Likely Causes: The file is not recognized as a Gherkin document, or the formatter is disabled.
Diagnostic Steps:
1. Check the bottom right corner of VS Code. Does the language mode say "Feature"? If not, click it and select "Feature".
2. Check your settings for "gherkinPowerTools.formatter.enabled": false.
Resolution: Ensure the file extension is .feature. Remove the disabling setting.
Diagnostics do not appear
Symptom: You type invalid Gherkin, but no red or yellow squiggly lines appear in the editor.
Likely Causes: The real-time linter has been disabled in the settings.
Diagnostic Steps: Check your settings for "gherkinPowerTools.linter.enabled": false. When disabled, the linter enters a completely dormant state to conserve system resources.
Resolution: Remove the setting or set "gherkinPowerTools.linter.enabled": true.
Format on Save does not work on some files
Symptom: You have Format on Save enabled, but the file doesn't format when saving. However, manually formatting it shows a warning. Likely Causes: The Gherkin file contains structural syntax errors. Resolution: Automatic formatting (like Format on Save) is intentionally designed to be silent when syntax errors are present. This prevents intrusive warning popups from interrupting you while you type an incomplete document. Fix the syntax errors (indicated by the red squiggly lines) and the formatter will resume working automatically.
Autocomplete suggestions are not sorted by popularity
Symptom: You use a step frequently, but it does not appear at the very top of the IntelliSense list.
Likely Causes: Gherkin PowerTools intentionally overrides raw popularity in favor of semantic relevance.
Resolution: The extension uses a strict 5-tier Lexicographical Ranking model. Exact text matches (Tier 1) and semantic keyword matches (Tier 2 - e.g. Given vs When) will strictly outrank steps that you simply use more often (Tier 5). This guarantees that autocomplete suggests the technically correct step over a popular but semantically incorrect one.
Developer Tip: Enable gherkinPowerTools.diagnostics.metricsEnabled and run Gherkin PowerTools: Explain Completion Ranking to see exactly why a step was ranked higher.
Autocomplete stops working for Scenario Outline Parameters
Symptom: You type < inside a Scenario Outline step, but the autocomplete suggestions for parameters (column headers) do not appear or are outdated.
Likely Causes: Your .feature file contains severe structural syntax errors that completely break the AST parser around the Examples table, and the temporary text-scanning fallback cannot safely determine the local table context.
Diagnostic Steps: Check for red error squiggles above or near the current scenario indicating a broken table or missing structural keyword.
Resolution: Ensure your Examples: table has a valid structure with at least a header row (e.g. | param1 | param2 |). Once the syntax error is fixed, the AST parser will instantly recover and precise parameter completion will resume.
Python steps are not found (Go to Definition / Autocomplete fail)
Symptom: You use Python Behave, but steps show as "Undefined" in the Linter, and Go to Definition does not work. Likely Causes: The extension is looking in the wrong directory, or your virtual environment is causing performance timeouts. Diagnostic Steps: 1. Run Gherkin PowerTools: Diagnose Workspace from the Command Palette. Check the "Discovered Steps" count. 2. Verify where your Python steps actually live. Resolution: Update your settings to include your custom path:
Virtual environments (.venv, env, node_modules, etc.) are automatically excluded by default via Zero-Config Virtual Environment Discovery to prevent performance timeouts. If you use a non-standard virtual environment name, ensure it is added to ignoreGlobs.
Ambiguous steps are reported unexpectedly
Symptom: The linter flags a step as "Ambiguous" even though Behave runs it fine.
Likely Causes: You have multiple regular expressions in your Python decorators that match the exact same string (e.g., overlapping wildcards like (.*)).
Resolution: Tighten your regular expressions in Python to be mutually exclusive.
I see double squiggles for Undefined, Ambiguous Steps or Syntax Errors
Symptom: Your feature file displays two overlapping underlines (e.g., one yellow, one red) for the same undefined step, ambiguous step, or syntax error (such as a misspelled keyword). The generic Syntax Error might also mask the Quick Fix bulb.
Likely Causes: Both the realtime Linter and the BDD Anti-pattern Detection Engine are configured to report on the same file, but the filtering mechanism failed or configuration is conflicting.
Diagnostic Steps: Check if "gherkinPowerTools.antiPatterns.enabled": true is set. The Anti-pattern Diagnostics Manager is designed to automatically filter out undefined-steps, ambiguous-steps, and syntax-errors from visual editor diagnostics to prevent conflicts with the realtime Linter (which provides the highly-granular Quick Fixes).
Resolution: This should be handled automatically by the extension (as of version 1.8.7). If you still see it, try reloading the VS Code window, or temporarily set the conflicting rule to "off" in gherkinPowerTools.rules.
Diagnostic suppression (Ignore this error) doesn't seem to work
Symptom: You clicked "Ignore this error" on a diagnostic (like oversized-scenario), but the warning still appears.
Likely Causes: In older versions, suppressions were strictly case-sensitive and didn't support multi-root workspaces correctly.
Resolution: Upgrade to version 1.8.6+. Suppressions are now safely canonicalized across macOS and Windows, and properly scoped to the active workspace folder. Check your .gherkin-pt-suppressions.json in the root of the specific workspace folder.
Rule Configuration (like maxSteps) is ignored
Symptom: You configured a rule like oversized-scenario to use a custom threshold (e.g. maxSteps: 20), but the engine still uses the default threshold.
Likely Causes: You might have used the legacy string-based format or incorrectly nested the object.
Resolution: Ensure you are using the Object-based configuration correctly in gherkinPowerTools.rules. It must look like this:
Yellow line (diagnostics) doesn't appear immediately on file open
Symptom: You open a feature file and the yellow squiggly lines for undefined or ambiguous steps do not appear until you type a character or switch files back and forth.
Resolution: This behavior was fixed in v1.8.4. The real-time Linter now triggers immediateLint directly on file load, bypassing standard debounce delays. Ensure you are on the latest version of the extension.
Quick Fix (Lightbulb) does not apply or fails silently
Symptom: You click a Quick Fix (e.g. to generate an undefined step or fix a misspelled keyword) and nothing happens.
Likely Causes: You continued typing in the .feature file after the diagnostic appeared but before you clicked the lightbulb.
Resolution: To protect against code corruption, Gherkin PowerTools strictly validates the document version. If the document has changed since the diagnostic was generated, the Code Action is aborted to prevent applying a stale edit. Wait a half-second for the linter to re-evaluate the file and generate a fresh Quick Fix lightbulb, then click it.
Impact Analysis CodeLenses are not appearing
Symptom: You open a Python step definition file, but you do not see the CodeLenses displaying the number of affected scenarios.
Likely Causes: The feature is disabled in settings, or the WorkspaceGraph is still indexing the feature files.
Diagnostic Steps: Check if "gherkinPowerTools.impactAnalysis.enabled": true is set in your configuration. Wait for the workspace indexing to complete.
Resolution: Enable the setting and ensure your .feature files and Python files are correctly mapped in your stepGlobs.
Generated step location is wrong or prompts for a workspace folder
Symptom: The Quick Fix generates a step, but places it in a file you didn't expect, or it asks you to select a workspace folder from a dropdown menu.
Likely Causes: The extension tries to append the new step to the most recently modified .py file within your stepGlobs paths. If you have no step files, it will create one based on standard conventions.
If you are in a Multi-Root Workspace, and the feature file being edited does not clearly belong to one of the roots, it will explicitly prompt you to select the correct target folder to prevent accidental cross-project modifications.
Resolution: Open the specific steps.py file you want to use, save it, and try generating the step again. The extension will pick up that file as the active target. If prompted for a folder, explicitly choose the intended project root.
Symptom: Step definition generation aborts safely and shows an error message like "Cannot read target file" instead of inserting the new step. Likely Causes: The target Python file exists but is unreadable (e.g., due to strict filesystem permissions or a temporarily disconnected remote filesystem like SSH/WSL). Resolution: This is a deliberate safety mechanism to prevent the extension from assuming the file is empty and injecting conflicting boilerplate. Verify your file permissions and remote connection status, then try generating the step again.
Test Explorer and Debugging
Test Explorer is empty
Symptom: You open the Testing sidebar, but no feature files or scenarios appear.
Likely Causes: The extension hasn't finished indexing, or there are no valid .feature files in the workspace.
Diagnostic Steps:
Wait a few seconds for the lazy-initialization to complete. If it still doesn't appear, ensure your .feature files contain valid Gherkin syntax (at least a Feature: keyword).
Resolution: Fix any critical syntax errors in your Gherkin.
Test Execution is Blocked (Untrusted Workspace or External File)
Symptom: You attempt to run a test from the Test Explorer or CodeLens, but VS Code blocks the execution or throws a "Cannot run Behave against a file outside of a workspace folder" error. Likely Causes:
- The extension uses VS Code's Workspace Trust API. If your workspace is marked as "Untrusted" (Restricted Mode), test execution is disabled.
- The
.featurefile you are trying to run is located outside of your currently open workspace folders (e.g. opened loosely or as an Untitled file).
Resolution:
- Click the "Restricted Mode" banner in the bottom status bar and select "Trust Workspace & Install" to enable test execution.
- Ensure you have explicitly opened the root folder containing the
.featurefile via File > Open Folder.... The extension strictly prevents execution on external files to protect your root disk from arbitrary runs.
Run fails (Behave executable is not found)
Symptom: You click "Play" in the Test Explorer, but the test immediately fails with a "Command not found" or "behave is not recognized" error in the output.
Likely Causes: behave is not installed, or your virtual environment is not active in the shell that VS Code spawns.
Resolution:
If using a virtual environment manager like Poetry or Pipenv, update your configuration in .gherkin-powertoolsrc.json or .vscode/settings.json:
Debugging does not stop at breakpoints
Symptom: You click the "Debug" icon, the test runs, but it ignores your red breakpoints.
Likely Causes: The Python extension is missing, or the debug session failed to attach to the behave process.
Resolution:
1. Ensure the official Microsoft Python extension is installed and active.
2. Ensure you clicked the Debug (Bug icon) in the Test Explorer, not the Run (Play icon).
Live Step Tracking animation is not visible
Symptom: The scenario runs in the Test Explorer, but the active step is not highlighted in the editor.
Likely Causes: The custom Formatter isn't emitting step_start events, or the file is not currently focused.
Resolution: Ensure your behave process has not overridden the custom JSON formatter, and verify that the .feature file you are running is currently open and active in the editor.
Syntax Errors cascade into massive false-positives
Symptom: You missed a colon on a Scenario, and suddenly all steps below it have red underlines.
Likely Causes: This was a known limitation of the AST parser in older versions.
Resolution: Upgrade to version 1.7.9+. The linter now gracefully falls back to a text-based scanner to isolate severe structural errors from your valid steps.
Statistics history data is lost or corrupted
Symptom: The historical trend charts are missing data points or show errors. Likely Causes: State corruption or an extreme refactoring drastically altering the codebase. Resolution: 1. Run the Clear History command to purge corrupted records safely. 2. The dashboard will start generating a fresh baseline on the next run.
Remote Development (WSL, SSH, Dev Containers, Codespaces)
Symptom: The extension cannot find Python, Behave, or local workspace paths when running inside a remote environment.
Likely Causes: Gherkin PowerTools correctly executes on the remote machine where the workspace is hosted (as a workspace extension). Absolute paths configured for a local OS (e.g., Windows C:\...) will fail when the extension evaluates them on the Linux remote host.
Resolution:
1. Ensure your gherkinPowerTools.behave.localExecutable or python.defaultInterpreterPath uses the path inside the remote environment.
2. Ensure you have installed the Behave dependencies on the remote host/container.
3. If using the CLI (npx @carlos-camara/gherkin-pt), ensure you run it from the Integrated Terminal in VS Code, which is connected to your remote environment, rather than your local OS terminal.
Statistics are empty or incomplete
Symptom: The Project Statistics dashboard shows 0 features. Likely Causes: The workspace indexer was interrupted, or you opened the dashboard immediately upon launching VS Code before the 2-second background scan completed. Resolution: Wait a few seconds, then close and reopen the dashboard.
Large workspace performance is poor
Symptom: VS Code feels slow when typing in .feature files.
Likely Causes: The extension is scanning too many files (e.g., inside .venv or node_modules), or the AST Cache memory budget is constantly thrashing on massive files.
Resolution:
1. Ensure gherkinPowerTools.behave.ignoreGlobs correctly ignores all dependency directories.
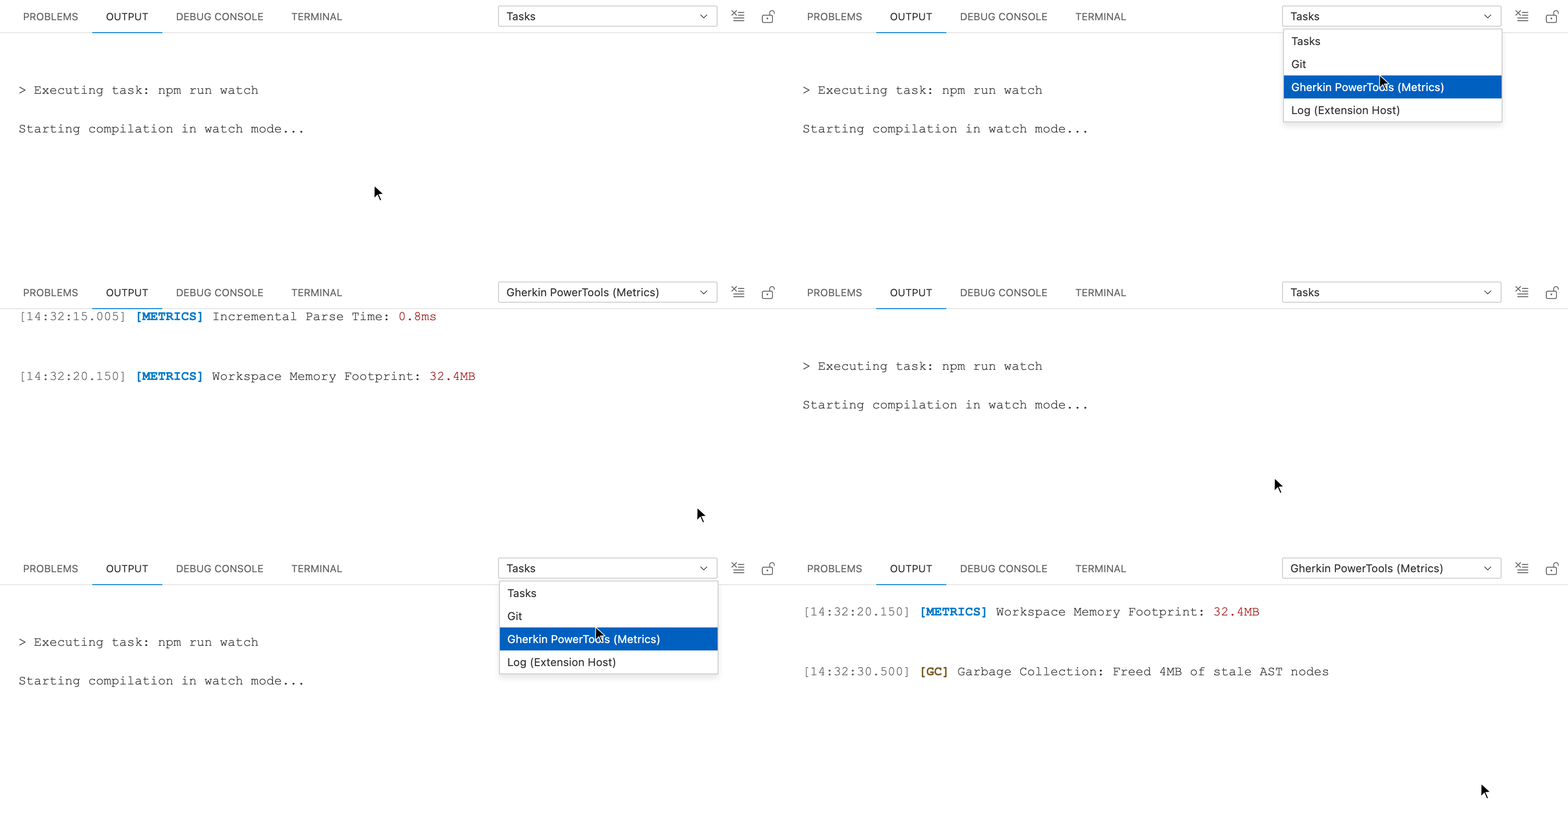
2. Enable gherkinPowerTools.diagnostics.metricsEnabled and run the Show Developer Metrics command to identify if specific files have high parsing durations, poor cache hit ratios, or if Cache Evictions are rapidly exhausting the 50MB memory budget.
Gherkin Health Dashboard is empty or incomplete
Symptom: You run "Show Gherkin Health" but the dashboard says "0 Total Step Defs" or misses files you know exist.
Likely Causes: Your gherkinPowerTools.behave.stepGlobs configuration does not cover the locations of all your steps.
Resolution: Ensure your Python step paths are correctly set in settings (gherkinPowerTools.behave.stepGlobs). The proactive indexer will automatically scan them upon running the command.
Rename Step does not find all usages
Symptom: You invoke the native VS Code Rename Symbol command (e.g., F2) on a Gherkin step, rename it, but some .feature files still use the old step name.
Likely Causes: The affected .feature files were not yet indexed in the WorkspaceGraph, or the Workspace Graph failed to initialize.
Diagnostic Steps:
- Ensure the Python step file containing the definition is within your configured
stepGlobs. -
Run Gherkin PowerTools: Diagnose Workspace and check the Bootstrap Capabilities section. If the
Workspace Graphshows afailedstate, review the error message provided.
-
Check the "Discovered Steps" section. Resolution: Verify
stepGlobscovers all relevant step files. If a capability failed, you can restart the extension Host. The graph is rebuilt automatically when files are saved.
Rename Step is not visible in the Context Menu
Symptom: You right-click in the editor, but "Rename Step" does not appear in the Gherkin PowerTools context submenu.
Likely Causes: To reduce clutter, the "Rename Step" command dynamically appears in the submenu only when your cursor is positioned directly on a valid step line.
Resolution: Ensure your text cursor is placed on a line starting with Given, When, Then, And, or But, then right-click and check the Gherkin PowerTools submenu again.
Extract Step does not produce a Python stub
Symptom: You select multiple steps and invoke the Code Action, but no stub appears in the target file.
Likely Causes: The selection may not span multiple step lines, or no Python step files were found in the workspace.
Diagnostic Steps:
1. Ensure you have selected at least two step lines (the selection must include both start and end lines).
2. Confirm that at least one Python step file exists within your stepGlobs.
Resolution: If no Python files appear in the file picker, add the correct glob to gherkinPowerTools.behave.stepGlobs.
VS Code Freezes or Stutters on Massive Feature Files
Symptom: Opening or pasting a massive .feature file (e.g., > 1MB of pure scenarios, such as > 10,000 scenarios generated automatically) causes VS Code to freeze or stutter for a brief moment, and the Extension Host might report unresponsiveness.
Why it happens: The native @cucumber/gherkin parser runs synchronously on the Extension Host main thread. For a typical file (under 1,000 scenarios), this takes < 20ms and is unnoticeable. For pathologically large files (> 10,000 scenarios), parsing can block the event loop for > 75ms.
Resolution:
- Break generated .feature files into smaller files (< 1,000 scenarios each).
- The extension employs debouncing to avoid running the parser on every keystroke, but initial loads or large pastes will block the thread until parsing finishes.
- A hard document-size guard (e.g., 2MB) may be implemented in future versions if abuse is widespread.
Files are missed or falsely flagged as duplicates (macOS/Windows)
Symptom: When scanning large workspaces, some .feature or .py files are ignored, or Behave step definitions are falsely reported as duplicated.
Likely Causes: In earlier versions, case-insensitive file systems could cause path mismatches inside the internal graph.
Resolution: Ensure you are running version 1.8.2 or newer, which includes robust case-insensitive URI normalization for macOS and Windows.
I accidentally dismissed a Contextual Recommendation
Symptom: You clicked "Don't show again" on a helpful popup (like the Formatting or Dashboard recommendation) and want it back. Likely Causes: The extension saved your dismissal in the workspace state. Resolution: Run the Gherkin PowerTools: Reset Contextual Recommendations command from the Command Palette to clear dismissals and allow helpful prompts to appear again.
Standalone CLI fails to resolve dependencies
Symptom: Running npx @carlos-camara/gherkin-pt analyze fails with a "Cannot find module '@cucumber/gherkin'" error.
Likely Causes: The CLI was installed globally or npm cached an outdated, non-scoped version of the CLI package.
Resolution: Ensure you are using the explicitly scoped package (@carlos-camara/gherkin-pt) and force a cache clear by running npx --yes --clear-cache @carlos-camara/gherkin-pt.
Formatter or Parser fails to load entirely
Symptom: Formatting, diagnostics, and step generation suddenly stop working, and the VS Code Output Channel (Gherkin PowerTools) displays "Failed to load Cucumber modules after 3 retries".
Likely Causes: Extremely slow Extension Host initialization or temporary filesystem locks preventing the loading of @cucumber/gherkin and @cucumber/messages modules.
Resolution: The parser attempts to heal itself by retrying up to 3 times. If all retries are exhausted, you can manually force a reload of the VS Code window (Developer: Reload Window). This is exceedingly rare in production builds (VSIX) but can happen during local development.
How to Report a Bug
If none of these steps resolve your issue, please run Gherkin PowerTools: Diagnose Workspace, copy the output, and Report an Issue on GitHub.