Gherkin Health & Analytics
Gherkin PowerTools includes a built-in Gherkin Health Dashboard that provides immediate insights into the architecture, quality, and maintainability of your BDD suite.
What the Dashboard Does
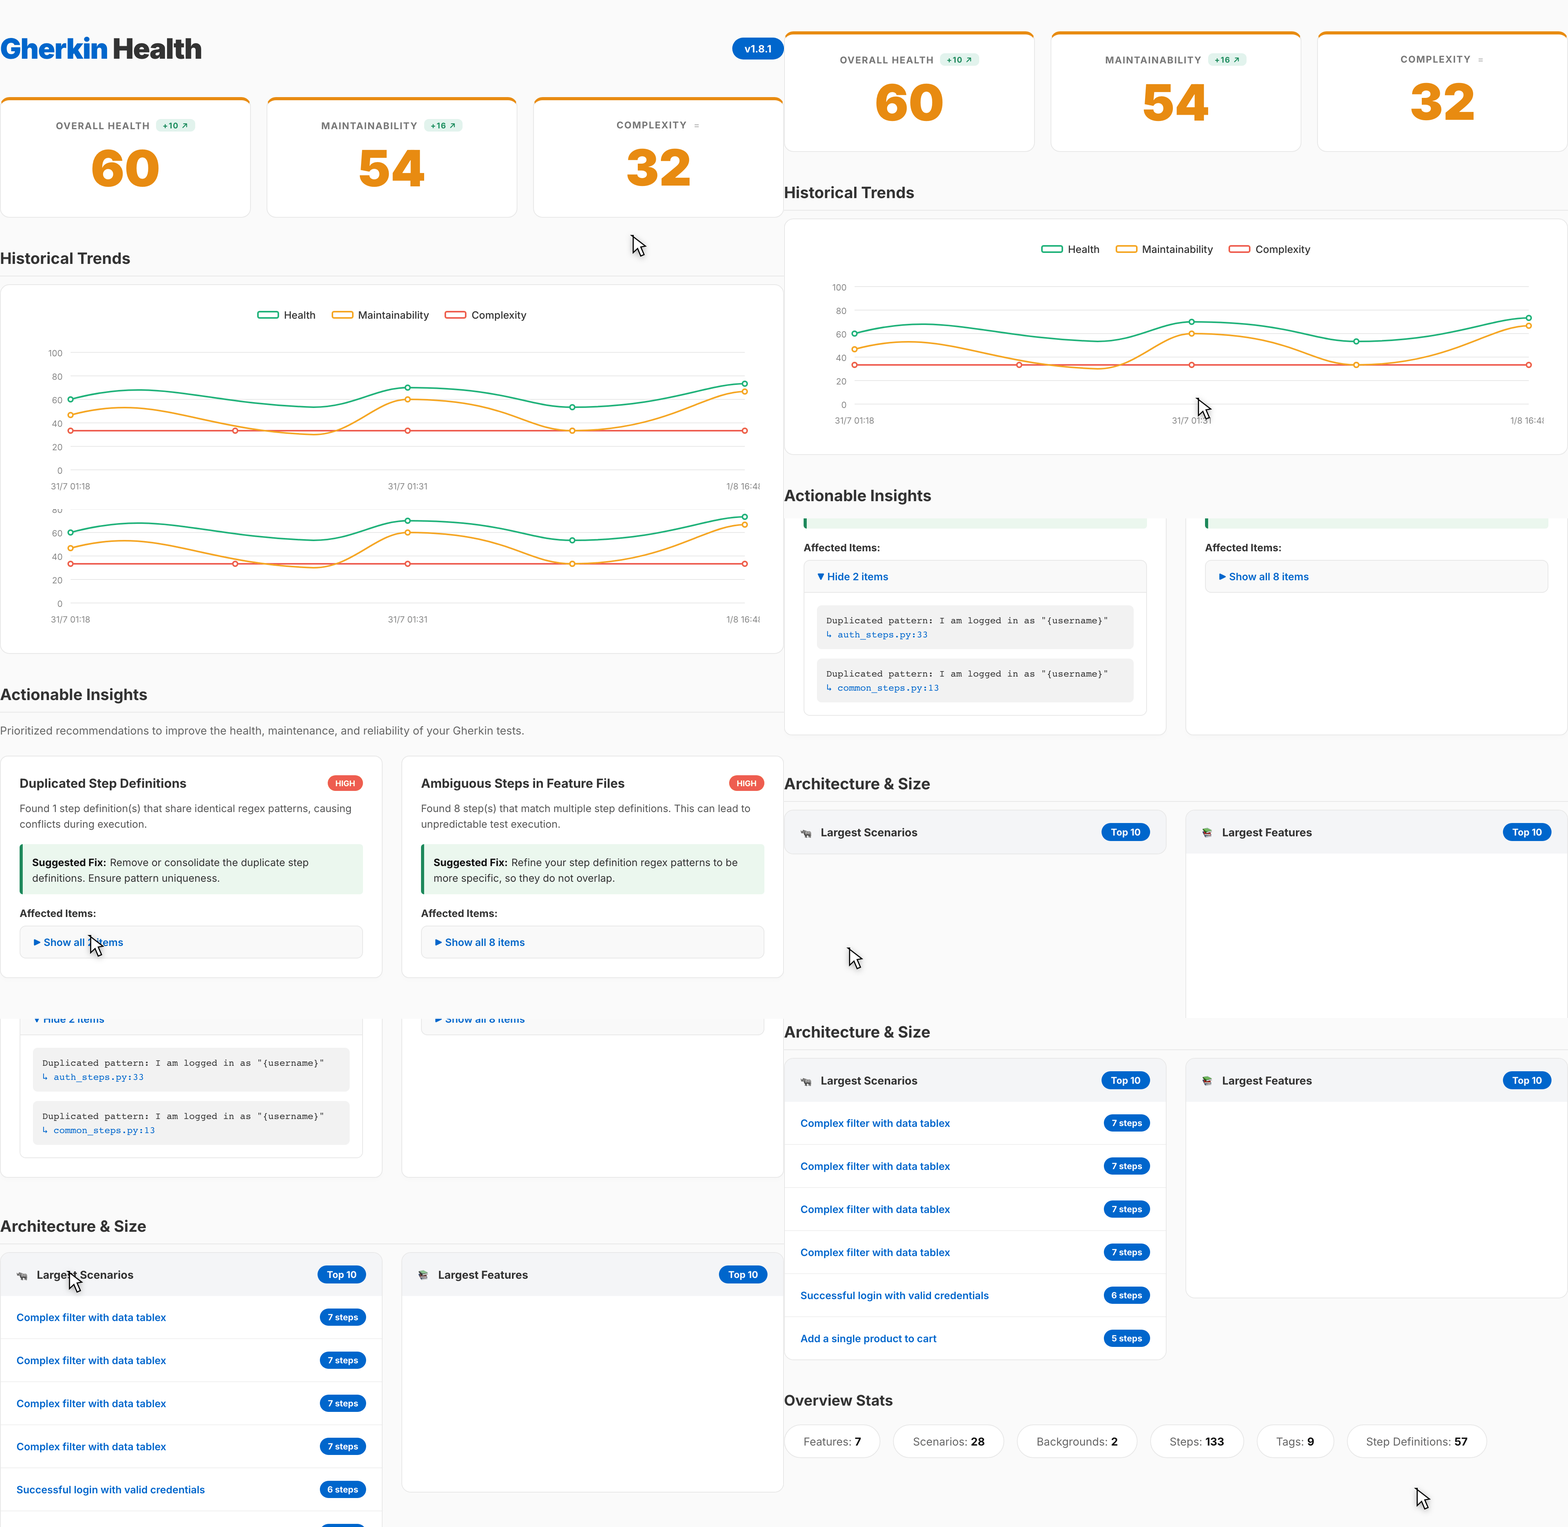
The Analytics Dashboard analyzes your workspace in real-time leveraging the in-memory Workspace Graph (which connects Features, Scenarios, Steps, and Python Step Definitions) and the BDD Anti-pattern Detection Engine.
It generates deep heuristics and scores, including:
- Overall Health Score: A unified metric indicating the general state of your test suite.
- Maintainability Score: Penalized by technical debt such as unused step definitions, duplicated patterns, and undefined steps in feature files. The dashboard uses progressive disclosure to show exactly how each metric penalizes the overall score.
- Complexity Score: An inverse metric tracking the verbosity of your suite (e.g. overly long scenarios, massive feature files). You can expand the score card to see the precise breakdown of complexity penalties.
- Technical Debt Breakdown: Immediate access to unused steps, duplicated steps, ambiguous steps, and undefined steps flagged by the Anti-pattern Engine.
The engine uses semantic context tracking to accurately resolve
AndandButsteps. It also smartly extracts the core regex pattern, ignoring execution keywords (Given/When/Then). The structural identity model uses nested object structures to safely index complex regular expressions containing colons or unicode, ensuring that step definitions reused across different contexts are not falsely flagged as corrupted or duplicated. - Actionable Anti-patterns: Prioritized rules (configurable as Error, Warning, Info, Hint, Off). The engine actively detects:
- Syntax Errors that cause parse failures
- Oversized Features and Oversized Scenarios
- Duplicated, Unused, Ambiguous, and Undefined Python step definitions
- Excessive Tags
- Inconsistent Formatting
- Architecture Insights: Rankings of the top 10 largest features and scenarios by step count, and top 50 most frequent tags.
Interactive Navigation: Every metric in the dashboard is clickable. Clicking on an oversized scenario, a duplicated step, or an unused step definition will instantly open the file and scroll to the exact line in your VS Code editor.
Real-Time Editor Diagnostics: Beyond the dashboard, the Anti-pattern Engine integrates directly with VS Code's problems view.
When enabled, it underlines rule violations (like Duplicated Steps or Oversized Scenarios) directly in your .feature and .py files.
To keep your editor responsive, these diagnostics are debounced by 500ms after a file change.
Note that Ambiguous Steps, Undefined Steps, and Syntax Errors are handled instantly by the real-time Linter (displaying immediate diagnostics and highly-granular Quick Fixes). They are automatically filtered out from the debounced anti-pattern engine to prevent duplicate squiggles and masking of the lightbulb action.
To prevent Quick Fixes from applying edits to stale code (e.g. if you continue typing before clicking the lightbulb), Gherkin PowerTools strictly guards its diagnostics using an internal diagnosticRegistry and document version validation. This isolates machine-readable diagnostic data from human-readable error messages.
Important: This dashboard provides static source analysis. It does not provide runtime test execution results, code coverage, pass/fail rates, or act as an Allure replacement.
Configuration
The Anti-pattern Detection Engine's behavior can be customized in your workspace settings or .gherkin-powertoolsrc.json. Rules are structured into categories (Correctness, Reliability, Maintainability, Style). While Correctness rules (like syntax errors) are absolute, heuristic rules (like Oversized Scenarios) can be fine-tuned.
Object-Based Configuration
You can configure rules using simple severity strings or objects to pass custom parameters like thresholds:
"gherkinPowerTools.antiPatterns.enabled": true,
"gherkinPowerTools.rules": {
    "oversized-scenario": {
        "severity": "warning",
        "maxSteps": 20
    },
    "oversized-feature": {
        "severity": "info",
        "maxSteps": 100
    },
    "duplicated-steps": "error",
    "ambiguous-step": "error"
}
See the Configuration Reference for the full list of rules.
Suppressing Findings
If a heuristic anti-pattern finding (such as an oversized scenario or a specific duplicated step) is deliberate or unavoidable, you can suppress it.
- Place your cursor on the rule violation in your editor.
- Open the Quick Fix menu (Cmd+. or Ctrl+.) and select Suppress 'rule-id'.
- You will be prompted to provide a mandatory reason (e.g. "Approved legacy component").
- The suppression is recorded in an external structural ledger at the root of your workspace (
.gherkin-pt-suppressions.json).
The diagnostic is immediately removed from the editor and filtered out of the Health Dashboard. The Dashboard header will display a shield badge indicating the number of active suppressions. Core parse errors (e.g., syntax-errors) cannot be suppressed.
How to View the Dashboard
To generate the dashboard:
- Open the Command Palette (Ctrl+Shift+P or Cmd+Shift+P), type and select Gherkin PowerTools: Show Gherkin Health.
- Or, right-click anywhere in a .feature file and select Gherkin PowerTools > Show Gherkin Health.
A Webview panel will open in VS Code displaying the generated HTML report. The dashboard is designed with a strict modern aesthetic, ensuring a premium, responsive, and minimalist native feel.
Note: The legacy "Analyze Step Definitions" command has been fully replaced by the unified Gherkin Health Dashboard.
Historical Trend Analysis
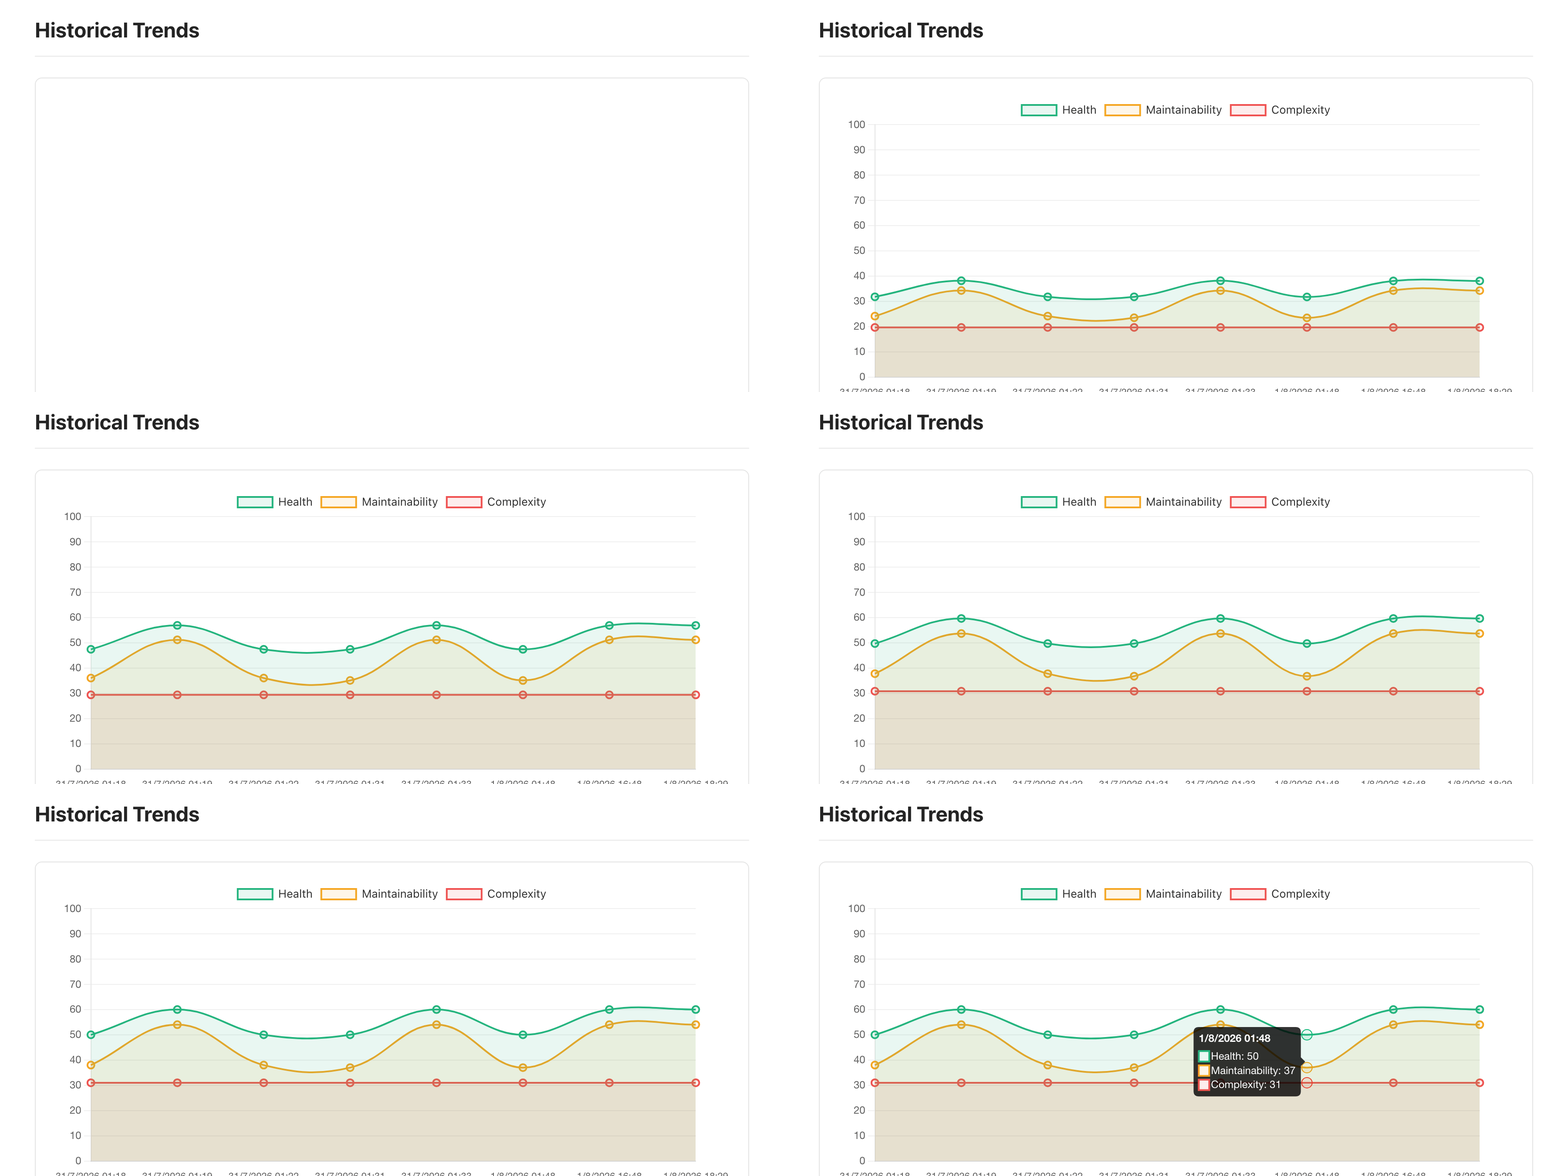
To help you monitor your project's quality over time, the Gherkin Health Dashboard tracks historical trends of your main metrics.
Each time you generate the dashboard, a lightweight snapshot is recorded. The dashboard features:
- Evolution Charts: A line chart visualizing how your Overall Health, Maintainability, and Complexity change over time.
- Delta Indicators: Quick visual cues (e.g., +5 ↗) showing improvements or regressions compared to the previous dashboard run.
Privacy First: All historical data is strictly stored locally on your machine using VS Code's
workspaceState. No analytics are sent to any external server.
This feature is enabled by default and retains the last 30 snapshots (configurable).
Storage and Isolation
The metrics history is designed to be highly reliable:
- Versioned Schema: Data is stored using a versioned schema (HistorySchemaV1), ensuring that future updates will not corrupt your history.
- Branch Isolation: To prevent mixing metrics from different streams of work, historical snapshots are isolated per Git branch. Changing branches will automatically load the history specific to that branch.
- Deduplication: Equivalent consecutive snapshots are automatically deduplicated to save space.
Managing History
You can manage your historical data using the Command Palette:
- Export History: Run Gherkin PowerTools: Export History as JSON to dump the raw snapshot data for use in your own reporting tools or CI pipelines.
- Clear History: Run Gherkin PowerTools: Clear History if you wish to reset your metrics data for the active workspace.
Tag Blast Radius
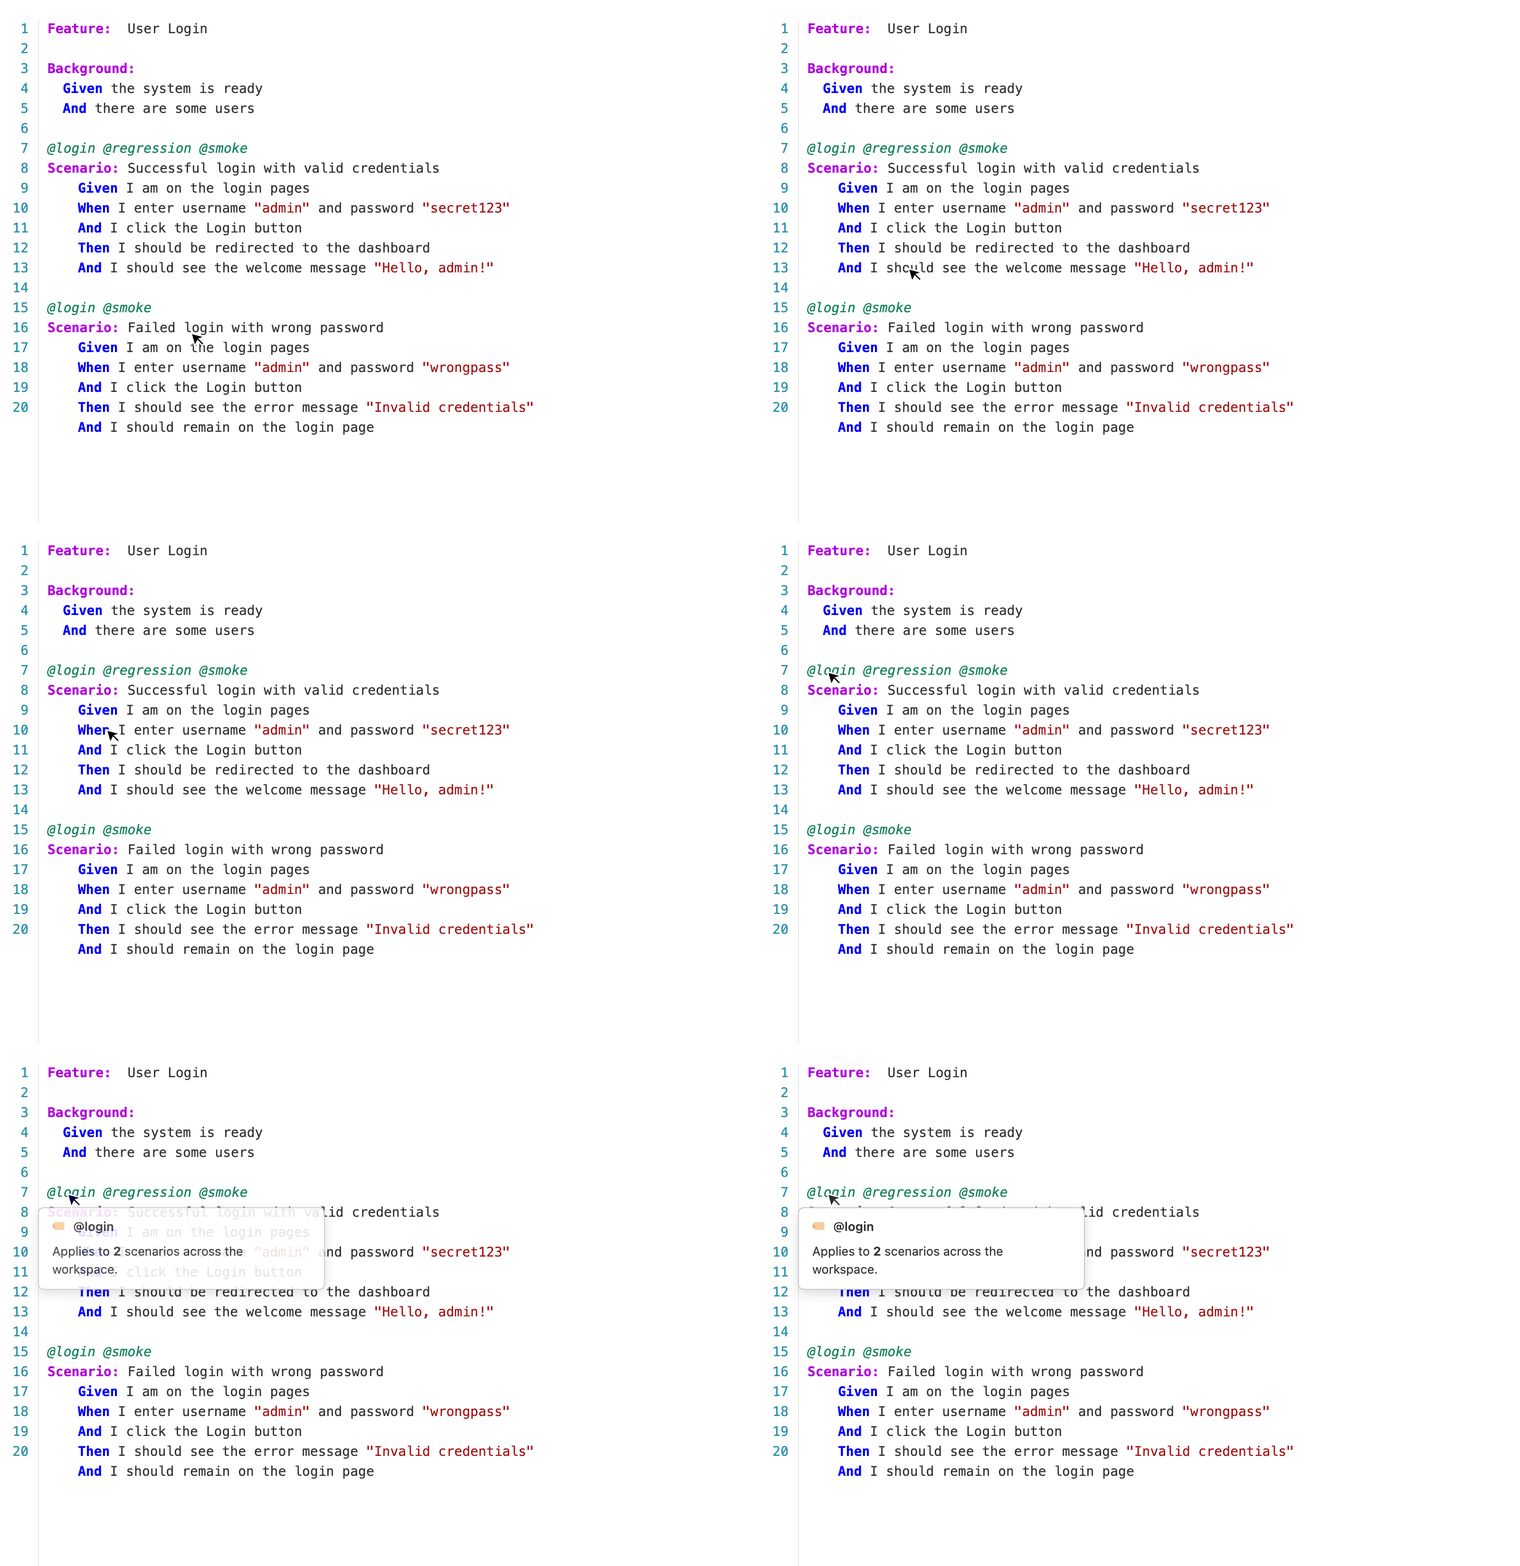
In addition to the global dashboard, the extension provides inline analytics for tags via Hover.
Hover your mouse over any @tag in a .feature file to calculate exactly how many Scenarios, Backgrounds, and Example rows that tag affects across your entire workspace.
This helps you understand the "blast radius" of executing a specific tag before you push code to CI.
Performance
- The dashboard relies on the internal
WorkspaceGraphandSymbolCache, which parse all.featureand Python step files upon workspace load. - Thanks to the graph architecture, the dashboard generation is completely $O(1)$ after initial indexing and loads instantaneously, even on enterprise repositories.
- Excluded folders (like
node_modulesor.venv) are appropriately ignored during the initial index to maintain performance. - To guarantee UI responsiveness in massive workspaces, the Webview employs strict DOM node limits. Rendering of affected items in technical debt lists is capped (e.g., maximum 30 files, 50 items per file). When limits are hit, the dashboard safely displays a "Show more" interactive button or an ellipsis, protecting the VS Code Extension Host from memory exhaustion.