Run and Debug (Test Explorer)
Gherkin PowerTools integrates directly with the native VS Code Testing sidebar to let you run and debug your Behave scenarios without ever touching the terminal.
Test Discovery
Open the Testing sidebar by clicking the flask icon in the Activity Bar, or press Ctrl+Shift+T (Cmd+Shift+T on macOS).
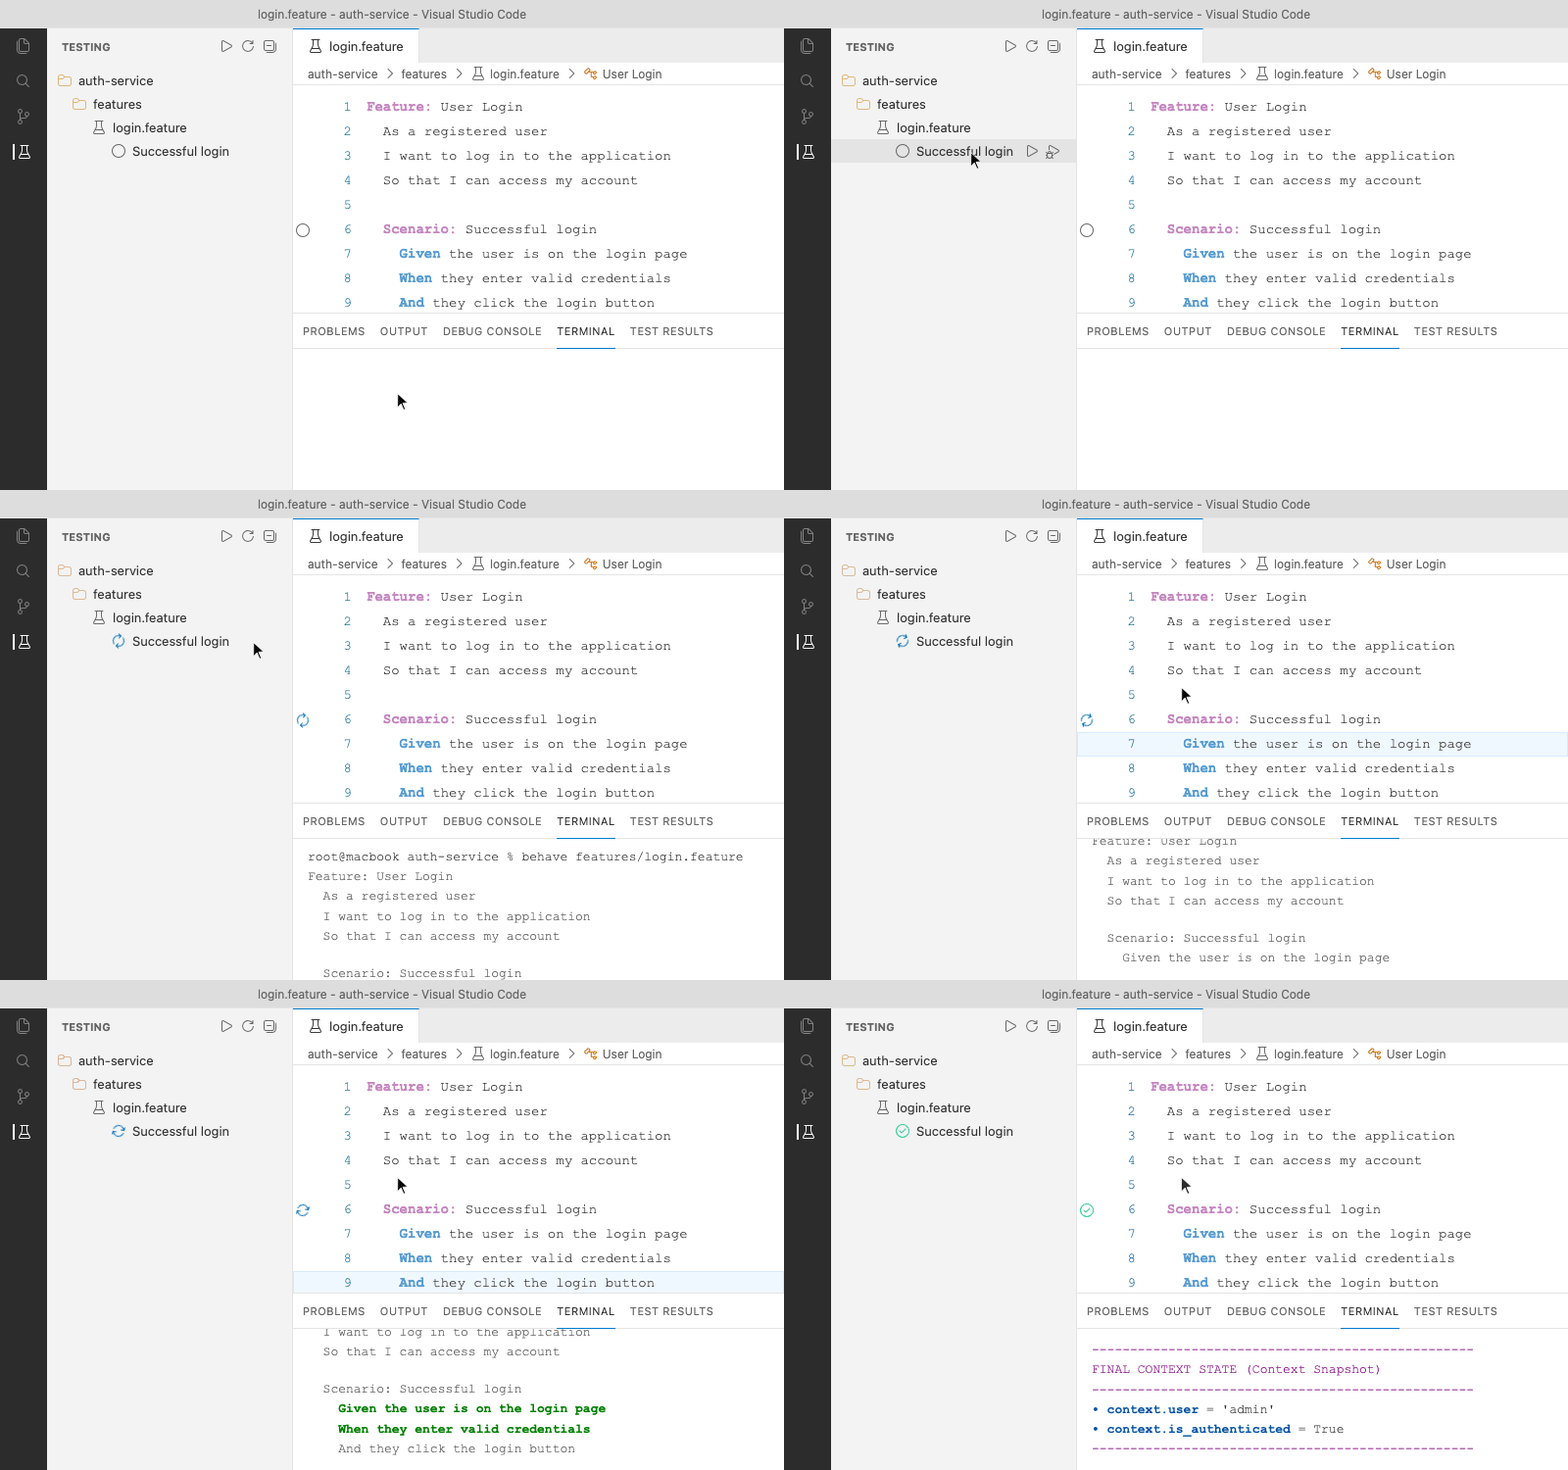
The Test Explorer populates a live tree of your workspace: - Feature Nodes - Rule Nodes - Scenario Nodes - Scenario Outline Example Rows (Allows you to run a single row of data from a table!)
The tree updates automatically as you type in your .feature files (debounced by 400ms). You do not need to save the file to see new tests appear. Thanks to native chronological sorting (sortText), scenarios are ordered exactly as they appear in your .feature files from top to bottom, rather than alphabetically.
Running Scenarios
You can run your tests at any level of granularity:
- Run Workspace: Click the Play button at the top of the Testing view to run all feature files.
- Run Feature: Click the Play button next to a specific
.featurefile. - Run Scenario: Click the Play button next to a single Scenario.
- Run Example Row: Click the Play button next to a single row inside a Scenario Outline.
Running Individual Example Rows
Version 1.7.8 introduced the ability to run or debug specific data rows within a Scenario Outline. You will see "Run" and "Debug" icons directly in the editor's gutter for each row under the Examples: table. This allows you to isolate and test specific datasets without running the entire matrix.
Console Output & Failure Reporting
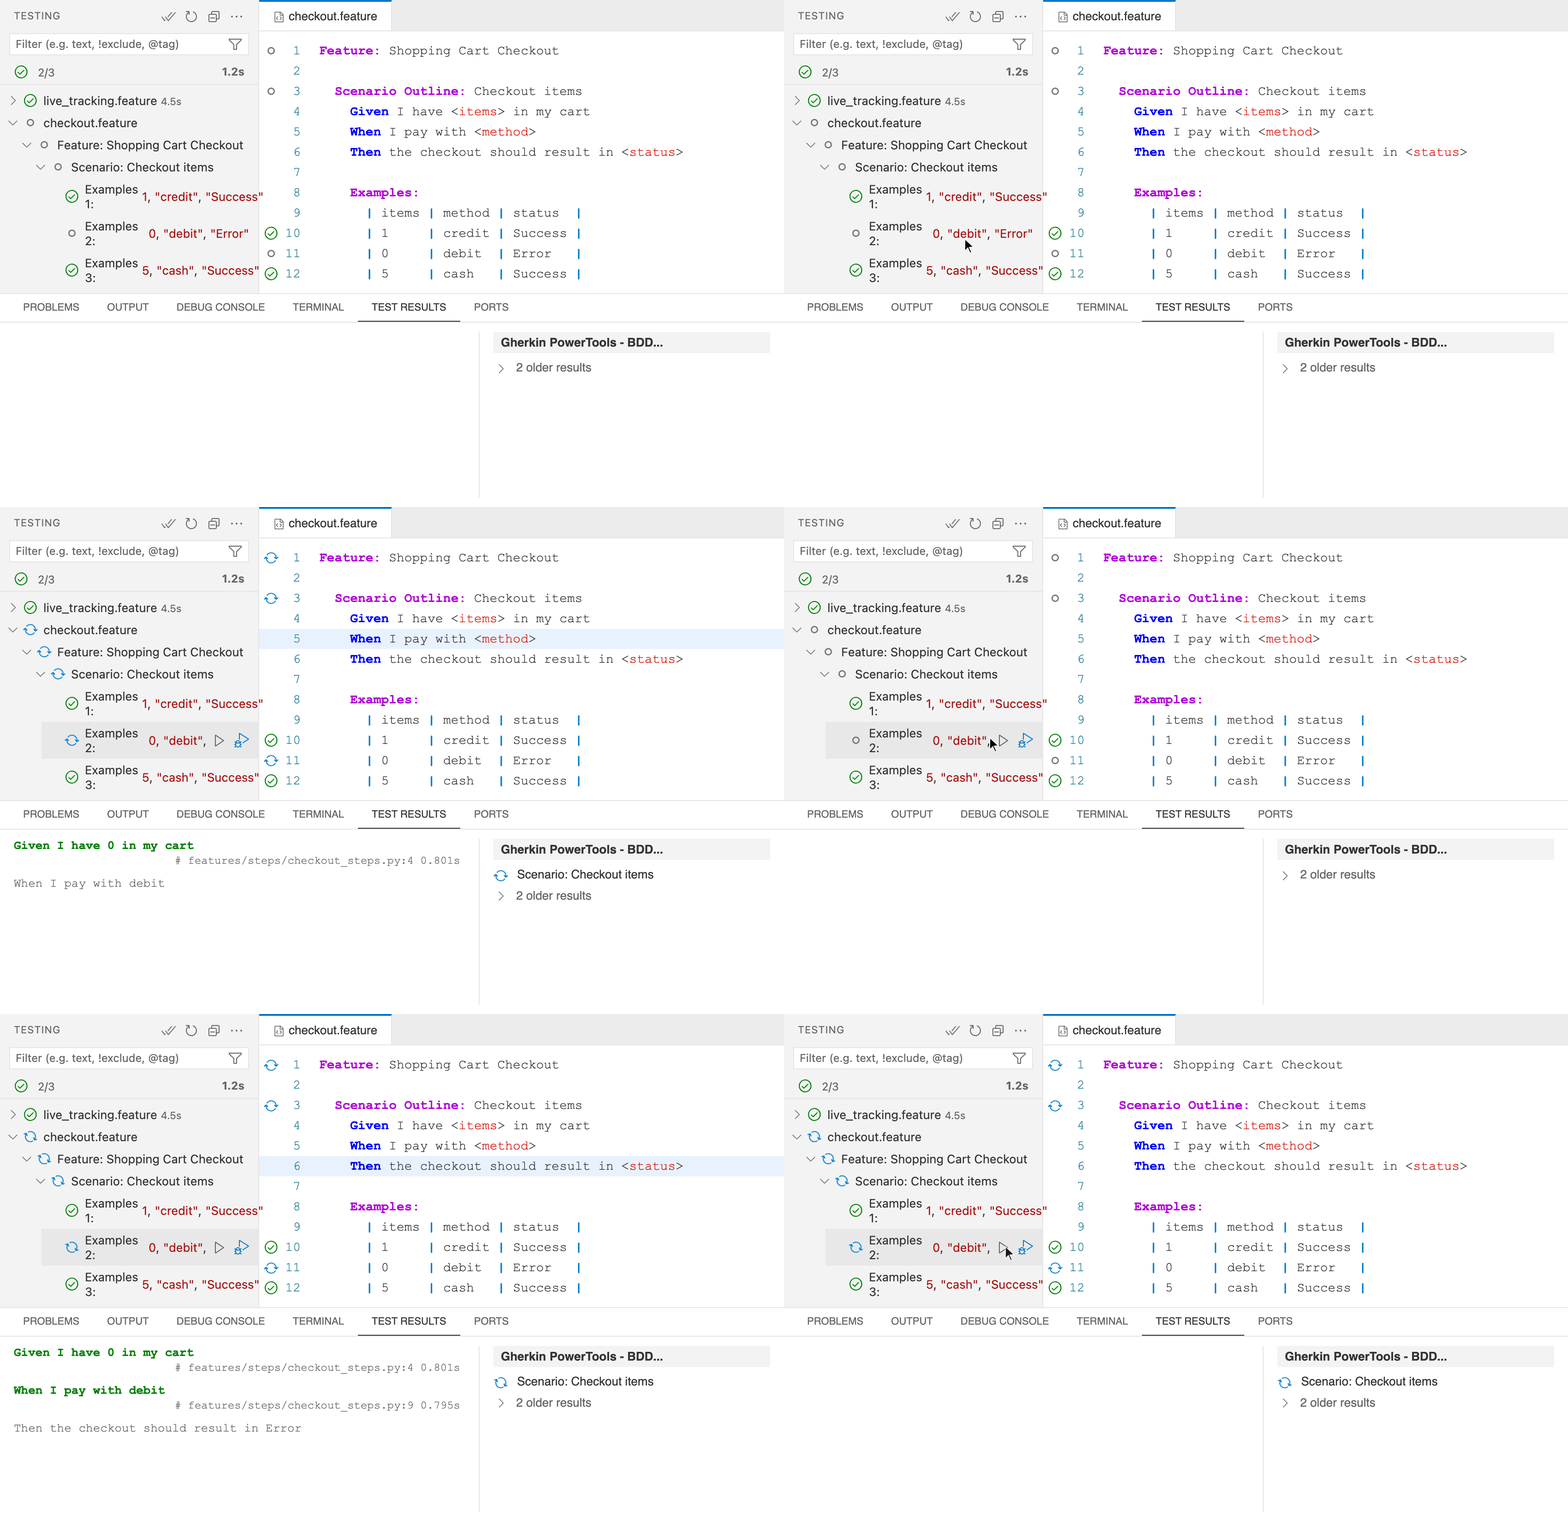
When you execute a test, the VS Code Test Results panel will display Behave's live standard output and standard error.
If a test fails, the node in the tree will turn red. To keep your editor clean, error messages and stack traces are collapsed by default.
You can view the exact failure details by explicitly clicking on the failed step or the error message within the Test Explorer.
Exception stack traces are fully formatted as Markdown code blocks for pristine readability inside the Test Peek view.
You can also quickly re-run only the failed scenario directly by clicking the "Run" icon next to the exception node (e.g., Failed at line X) in the Test Explorer.
Live Step Tracking (Execution Animation)
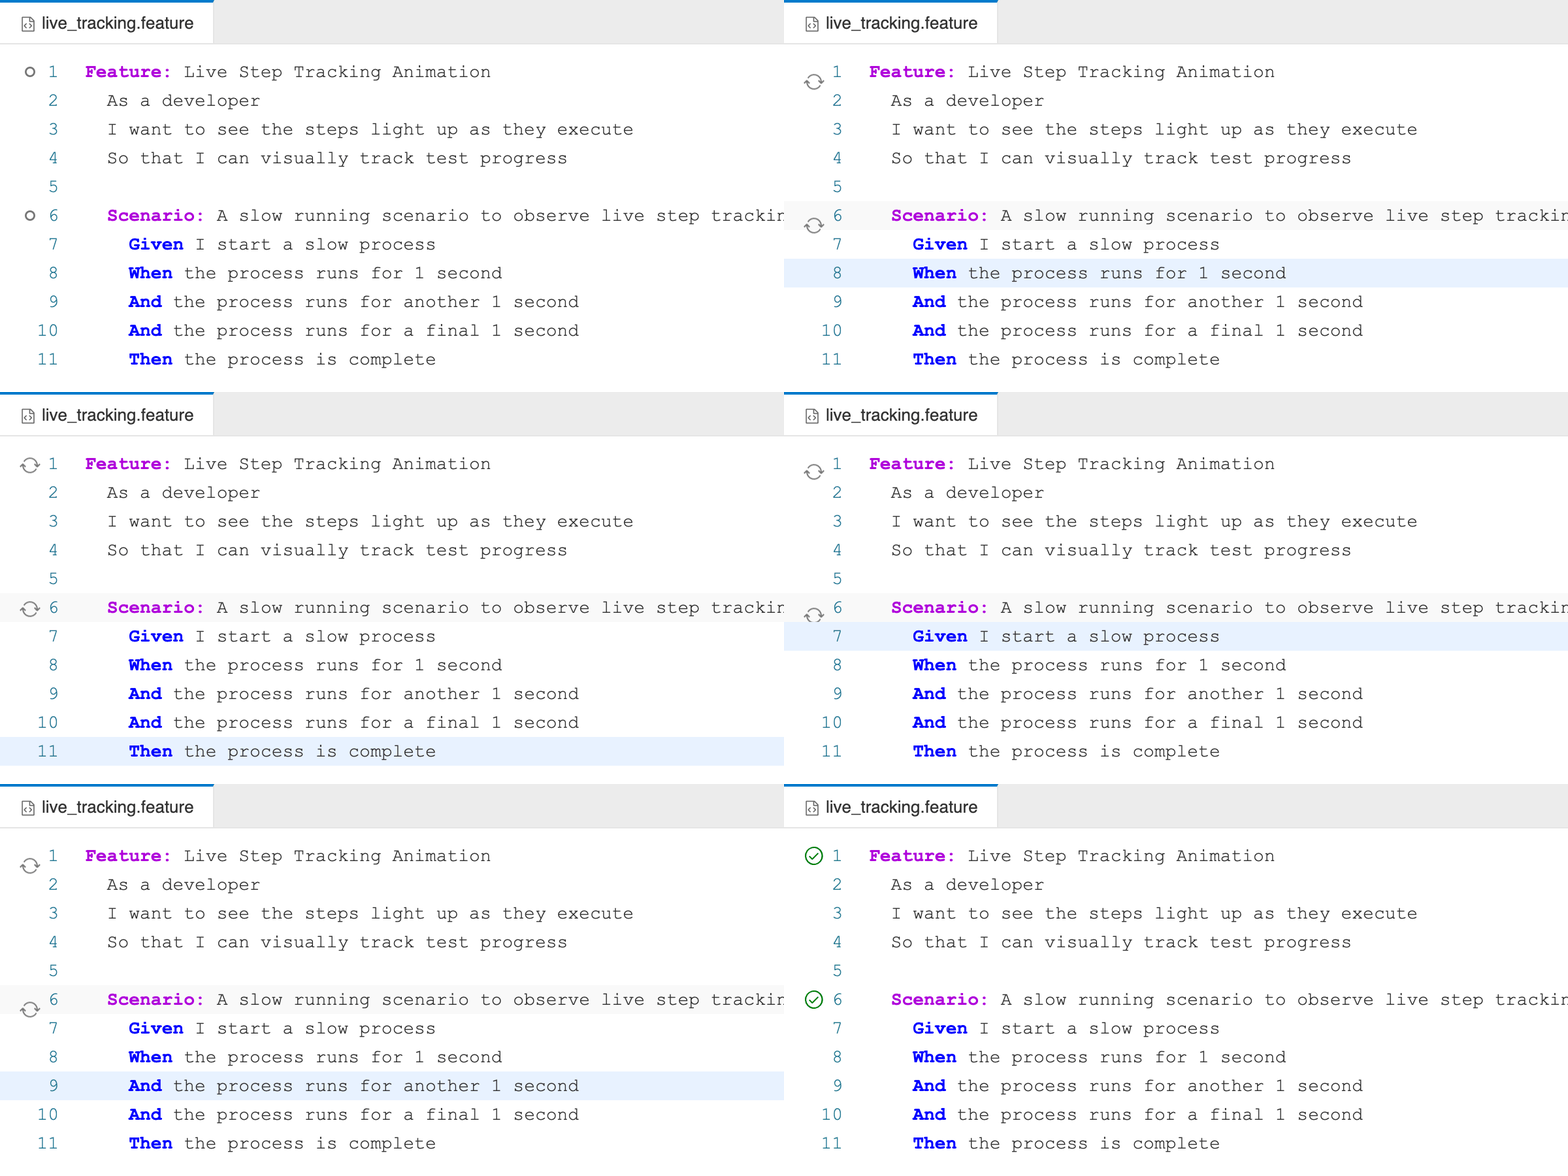
As Behave executes your scenarios in the background, Gherkin PowerTools receives real-time step_start events. The extension uses VS Code's decoration API to visually highlight the exact step currently executing in the .feature file. You can watch your scenario "run" line by line right inside the editor!
Final Context State (Context Snapshot)
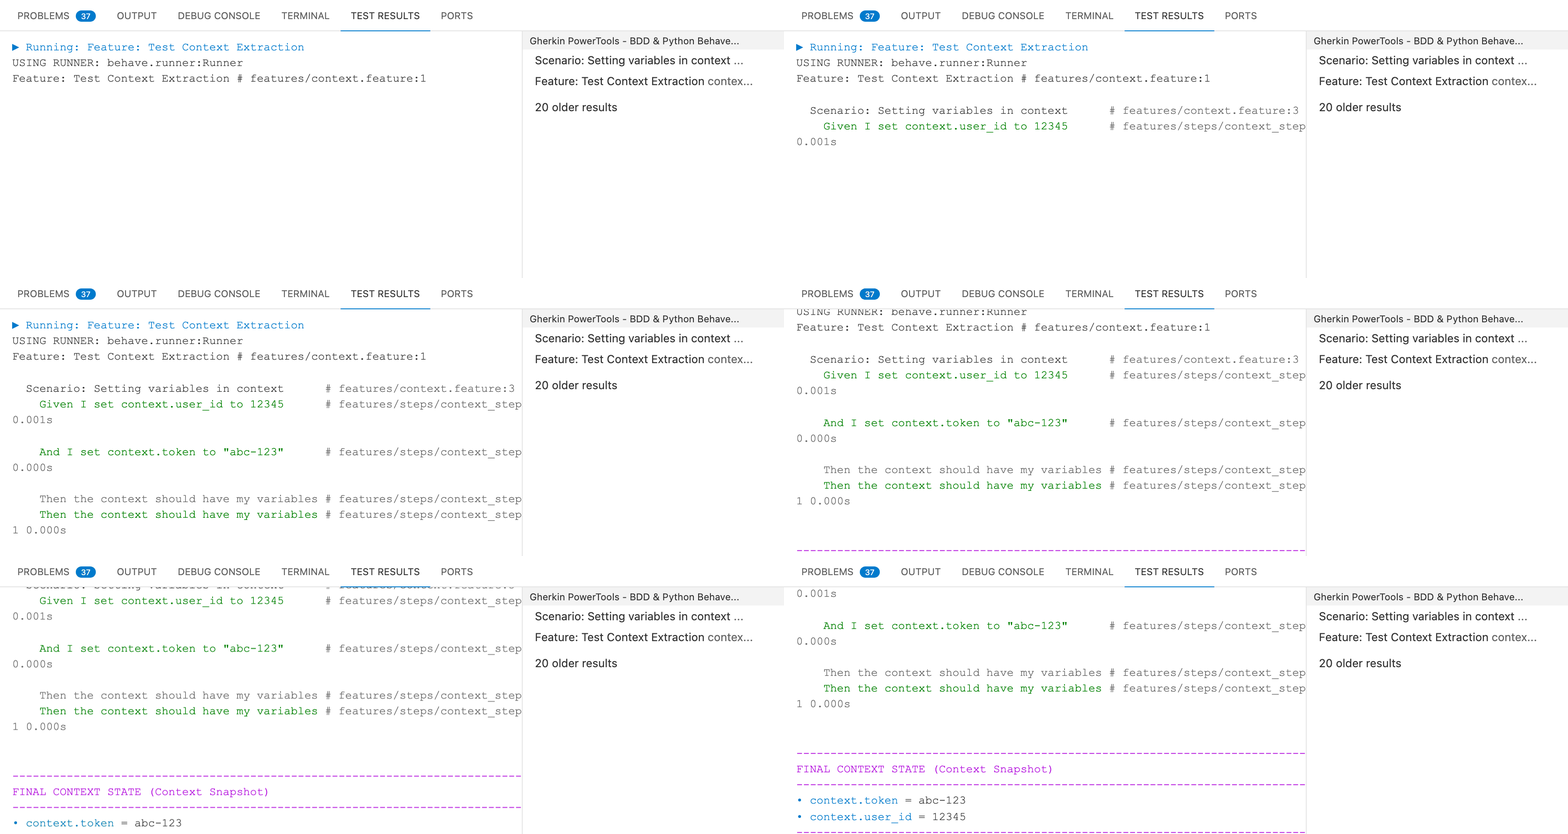
When a scenario finishes executing, Gherkin PowerTools automatically inspects the Behave context object and extracts all variables that were dynamically set during the run. This snapshot is formatted and injected directly into the Test Results output, allowing you to easily verify your test data state without needing to attach a debugger.
Navigation & Focus Mode: Clicking on any Feature, Scenario, or Example row in the Test Explorer will intuitively navigate you directly to its definition in the .feature file. The Focus Mode automatically illuminates the selected block with a strong accent border, making it instantly distinguishable even in massive files.
Cancellation
You can safely cancel a frozen or long-running execution by clicking the Stop button (Square icon) in the Test Explorer. The extension issues a forceful SIGKILL command to guarantee the underlying Python process terminates immediately.
Debugging
Gherkin PowerTools makes attaching the Python debugger to Behave trivial.
Note: You must have the official Python extension installed to use the debugger.
How to Debug
- Open your Python step definition file.
- Click in the left margin to place a red Breakpoint inside the step you want to debug.
- Open the Test Explorer.
- Click the Debug (Bug icon) next to the Scenario or Feature you want to run.
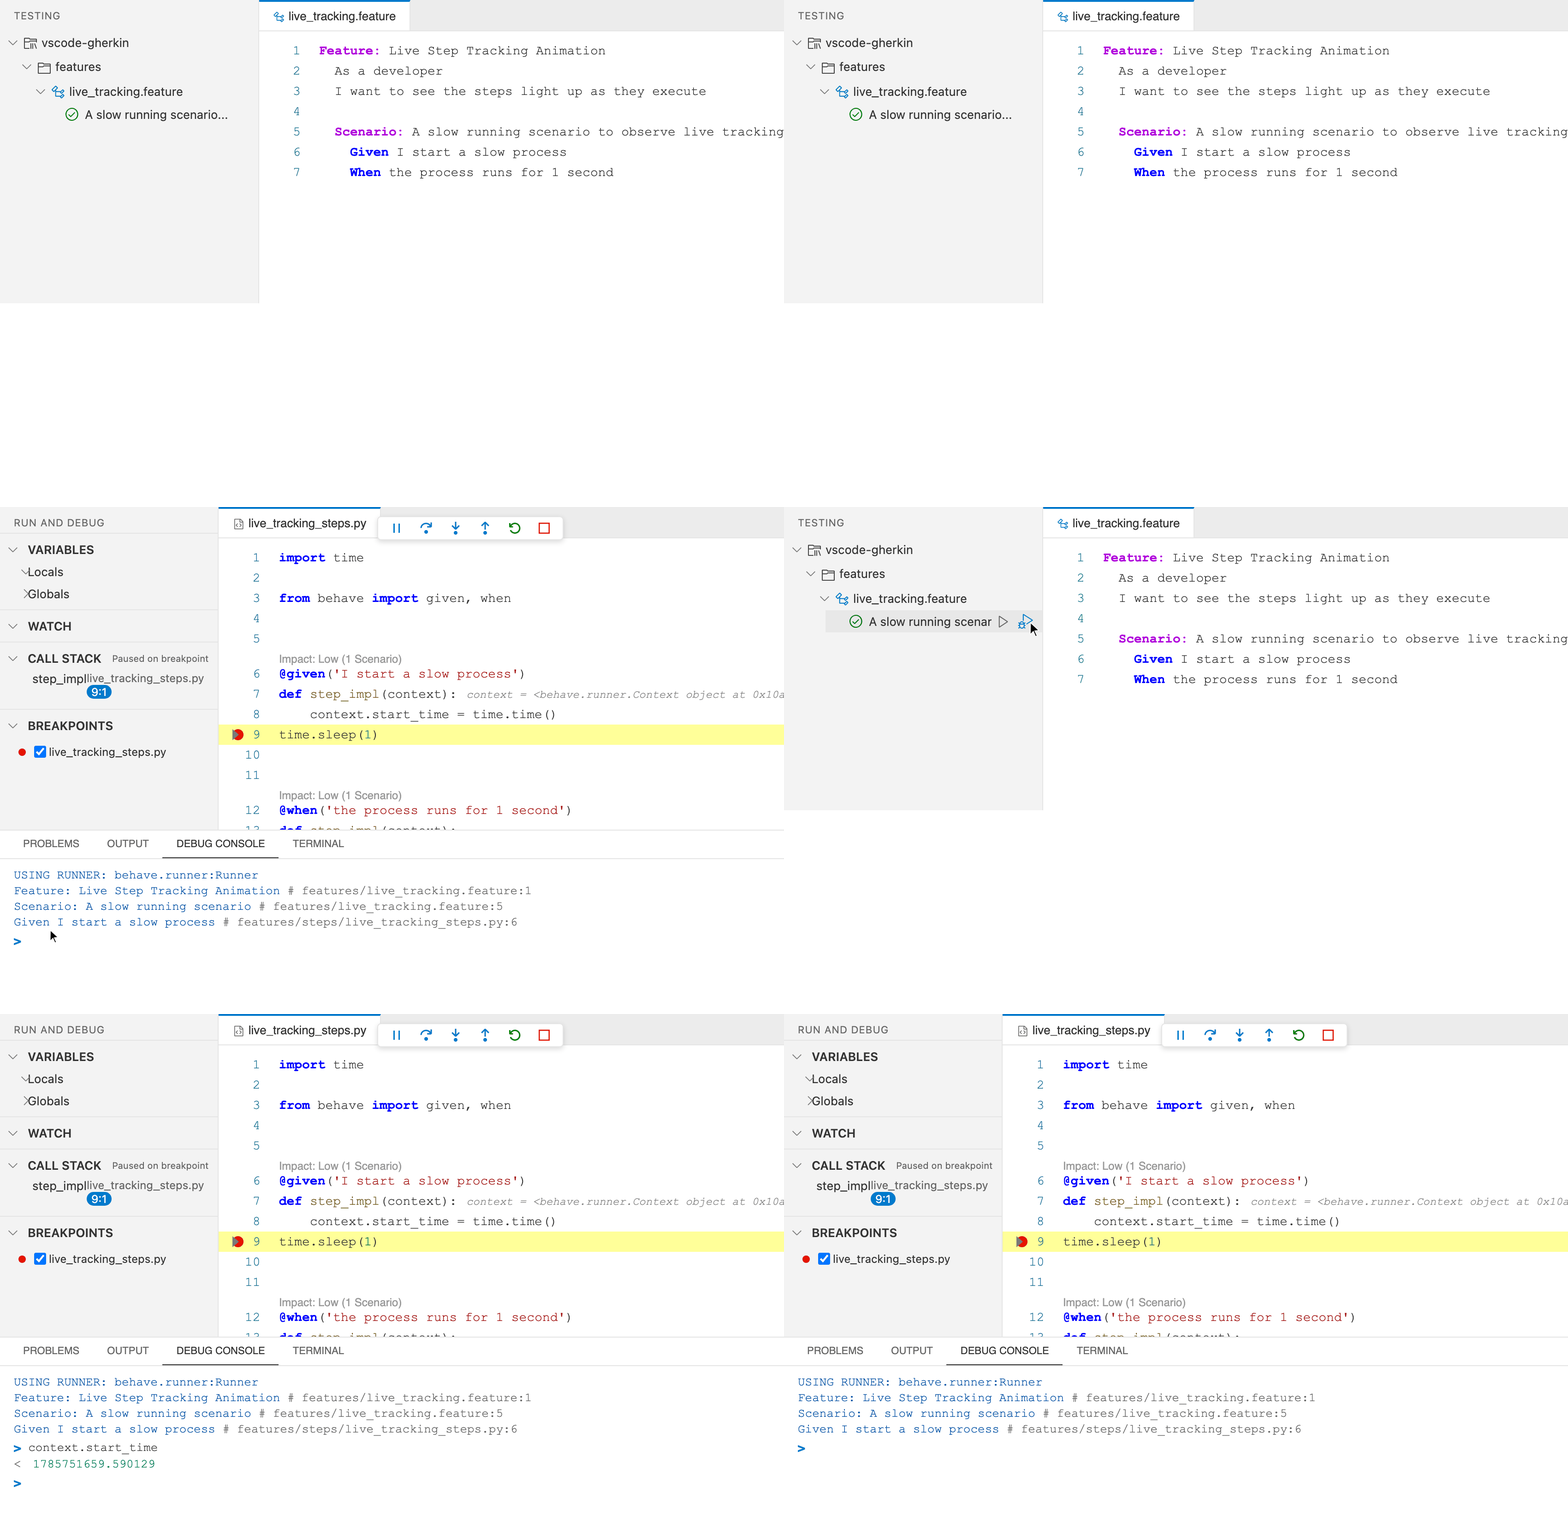
The extension will launch Behave attached to debugpy. Execution will halt at your breakpoint, allowing you to inspect variables, step into functions, and evaluate expressions in the Debug Console.
Debug vs Run Profiles
- The Run profile creates a test run and updates pass/fail badges in the UI.
- The Debug profile launches an isolated debug session. It intentionally does not overwrite your previous test history (green checkmarks remain intact).
Customizing the Execution Environment
By default, the extension uses Zero-Config Environment Discovery. It securely communicates with the official Microsoft Python extension to detect your active virtual environment.
If the Microsoft Python extension defaults to a global interpreter, Gherkin PowerTools will automatically search your workspace for local virtual environments (e.g. .venv, venv, env) and prioritize them without any manual configuration.
If you need to override the execution engine entirely (e.g. wrapping Behave inside a docker command or a custom runner script), you can configure the base executable securely using the structured behave.execution object in your portable .gherkin-powertoolsrc.json or .vscode/settings.json:
"gherkinPowerTools.behave.execution": {
    "executable": "docker-compose",
    "arguments": ["run", "--rm", "test-runner", "behave"]
}
Machine-Specific Overrides
If you need to use an absolute path (e.g. to a local Python interpreter or a .venv/bin/behave executable), you should not commit this to your shared settings. Instead, use the machine-overridable setting in your global User Settings:
executable specified in behave.execution, keeping your project configuration portable and secure.
You can also pass persistent arguments (like passing userdata to the environment):
Edit Arguments & Run
If you need to change arguments on the fly (e.g., adding --tags=@wip for a single run without modifying your settings), use the Edit Behave args & Run button at the top of the Test Explorer view.
Remote Workspaces (Dev Containers, WSL, SSH)
Gherkin PowerTools fully supports remote development environments. Because the extension executes the configured command directly in the workspace, Behave tests will seamlessly run inside your Docker container, WSL instance, or remote SSH machine exactly as they do locally. No additional configuration is required, just ensure Behave is installed in the remote environment's Python path.
Troubleshooting Execution
- "Behave executable not found": By default, Gherkin PowerTools automatically detects local virtual environments (like
.venv,venv,env). If your environment is elsewhere, ensure it is selected in the VS Code status bar and thatbehaveis installed in it. If you need to manually specify a path for a non-standard setup, you can use thegherkinPowerTools.behave.localExecutablein your User Settings to point to the absolute path of your Behave executable (e.g.,.venv/bin/behave). -
"Tests are not discovered or do not run": Ensure your workspace is Trusted. For security reasons, the extension blocks Behave execution in Untrusted (Restricted) workspaces.
-
Tests run but show no output: Ensure you aren't passing arguments that suppress output, or add
--no-capturetoadditionalArgumentsif you need to seeprint()statements. - Breakpoints not hitting: Ensure you are clicking the "Debug" icon (bug), not the "Run" icon (play). Confirm your Python extension is active.