Performance and Activation
Gherkin PowerTools is designed to remain lightweight and unobtrusive, even in very large enterprise codebases with thousands of .feature and .py files.
Activation Lifecycle
The extension uses lazy activation (onLanguage:feature). It will not start, load dependencies, or consume memory until you open a Gherkin document.
Workspaces without Behave
If you open a Gherkin document in a project that does not use Python Behave, Gherkin PowerTools gracefully functions as a pure formatter and structural linter. It automatically disables the Python step discovery engine, ensuring zero overhead from file watchers or AST parsing of irrelevant languages.
Large-Workspace Behavior
When Behave is detected, the extension builds a robust index to provide navigation and IntelliSense.
- Deferred Indexing: Heavy workspace scanning is offloaded to background threads and does not block the VS Code Extension Host. Editor features (like formatting and syntax highlighting) are immediately available.
- Fault-Isolated Capabilities: Core systems (like Symbol Cache and Workspace Graph) boot up as isolated capabilities. If an optional cache takes too long or fails to read from the disk due to locking, it automatically retries with exponential backoff without halting the essential file-watching systems, ensuring immediate responsiveness.
- Debounced Watchers: File system changes are debounced. Rapid modifications during saving or git branch switches will not flood the system with redundant re-indexing events.
- Batched Linter Invalidation: The Linter engine aggregates file events (
documentOpened,documentChanged,stepDefinitionsUpdated) into a shared, debounced invalidation queue. This buffers event spikes and executes validation in concurrent batches governed by a strict concurrency limit (maximum 5 concurrent parses). During massive branch switches where hundreds of documents might update simultaneously, this architecture entirely prevents CPU starvation and Extension Host freezing, while still ensuring diagnostics eventually stabilize. - Dormant Linter Execution: When
gherkinPowerTools.linter.enabledis set tofalse, the Linter instantly enters a completely dormant state—it bypasses enqueueing, timeout tracking, and AST parsing entirely, guaranteeing zero CPU overhead on file modifications. - Weighted LRU AST Caching (Soft Memory Budget): Gherkin document parsing is centralized via the
AstRepository. When multiple language features request the abstract syntax tree simultaneously, they share the exact same parsed object. To safely handle massive workspaces (e.g. 1000+ files), the AST cache dynamically tracks estimated memory size and enforces a ~50MB soft limit, selectively evicting only the oldest documents to keep hit ratios maximized without exhausting Extension Host memory limits. - Robust Autocomplete Syntax Fallback: While active typing in a
.featurefile might temporarily break the Abstract Syntax Tree (e.g., before finishing a step or a table), the autocomplete engine features an instantaneous, constrained text-scanning fallback to guarantee perfectly fluid keystroke responses and parameter suggestions without stuttering. - O(1) Autocomplete Hot-Path: Replacing legacy O(N) line-by-line regex scanning, the interactive IntelliSense
hot-path now uses a strict
CompletionContextCache. The engine fetches semantic tags and local step texts directly from the memoized AST, binding the context snapshot to the document version. Subsequent completions fetch this context in~0.0004ms, rendering the autocomplete engine completely independent of file size. - Reference Resolution (Shift+F12): Because every
StepNodemaintains a direct structural link to itsStepDefNode, resolving usages globally does not require a workspace-wide grep or regex search. It operates in $O(1)$ time, returning results instantly regardless of project scale. - Transactional Mass Updates: During massive file changes (e.g., switching git branches where thousands of files change simultaneously), the
WorkspaceGraphemploys an immutableWorkspaceGraphGenerationmodel. It coalesces all file events, safely aborts stale index requests, and commits updates atomically. This guarantees O(1) structural indexing across the entire workspace without locking the extension host or causing event-loop delays. - Authoritative Feature Discovery: The
FeatureDiscoveryServiceacts as a single, debounced source of truth for all*.featurefiles, avoiding redundant file system scans by the Test Explorer, diagnostics engine, and caching layers. - Optimized Behave File Discovery: The
BehaveFileDiscoveryServiceandFeatureDiscoveryServiceavoid blindly destroying and recreating file system watchers. They cache active configuration globs and only reconstruct watchers when resolved patterns genuinely change. In multi-root workspaces, they selectively rebuild only the affected workspace folders. Furthermore, they aggressively deduplicate overlapping concurrent file-system events into a single pending state per URI, neutralizing "thundering herd" bursts (likegit reset --hard) before they reach downstream components. - Targeted Cache Invalidation: When profile-based configurations change (e.g., via
.gherkin-powertoolsrc.json), the Workspace Event Bus emits fine-grainedstepDiscoveryConfigChangedandfeatureDiscoveryConfigChangedevents. TheSymbolCacheandFeatureCacheintercept these events to flush and rebuild only the specific workspace folder's cache that was affected, avoiding costly, full-workspace rebuilds. - Impact Analysis CodeLenses: The real-time Blast Radius CodeLenses rely on the
WorkspaceGraphto resolve usages instantaneously, ensuring that no file-system scanning is performed when you open a Python step definition file. - Proactive BDD Anti-pattern Analysis: When generating the Gherkin Health Dashboard, the Anti-pattern Engine actively fetches and parses all
.featureand.pyfiles to ensure 100% accurate coverage. This one-off deep scan guarantees accuracy but is isolated to the execution of that specific command, preserving editor responsiveness during normal typing.
Execution Engine Overhead (CodeLens & UI Sync)
- Blast Radius CodeLens Updates:
< 1ms - Reference Provider Lookups (Find All References):
< 5ms - Gherkin Health Dashboard Sync:
< 15ms - Test Explorer Discovery & Refresh:
< 10ms(Independent of total workspace nodes due to virtualized DOM updates)
Extension Host Latency Budget
To maintain a smooth 60fps typing experience, the extension strictly governs its main-thread execution time:
- The native @cucumber/gherkin parser executes synchronously, blocking the Extension Host event loop during the parse.
- Benchmarks show that 99% of real-world .feature files (under 1,000 scenarios) parse in <20ms, fitting perfectly within acceptable Extension Host latency budgets without the severe IPC overhead of worker_threads.
- Massive, pathologically large files (>10,000 scenarios or >1MB) may block the thread for ~75ms, causing a momentary stutter upon opening or pasting, but remain well below the 500ms critical threshold.
- Aggressive debouncing ensures this synchronous parse only fires when the user pauses typing, completely eliminating typing latency.
Parser Diagnostics & Developer Metrics
To monitor the performance of the AstRepository, you can enable parser metrics by setting "gherkinPowerTools.diagnostics.metricsEnabled": true in your configuration. This activates the Gherkin PowerTools: Show Developer Metrics command, which provides:
- Parse Durations: Track how long it takes to generate ASTs.
- Cache Hit Ratios: See how often the extension successfully reuses AST objects instead of reparsing documents.
- Cache Evictions & Memory: Monitor how many AST objects are evicted under the 50MB budget and the estimated current memory footprint of the repository cache.
- Document Complexity: Monitor the total number of features, scenarios, and steps parsed.
- Parser Failures: Track documents that failed to parse due to malformed Gherkin.
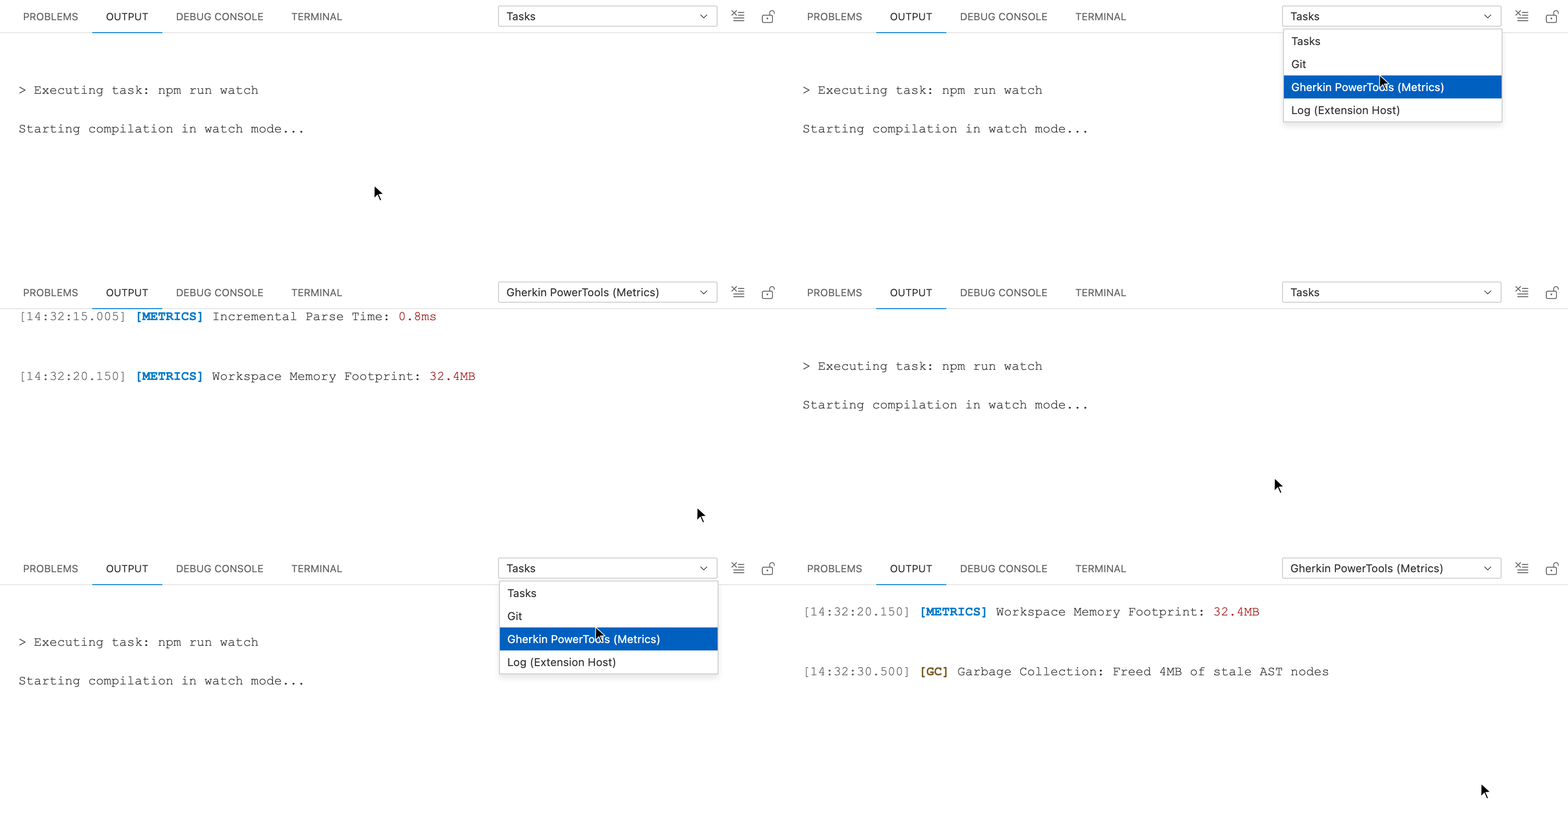
These metrics are collected independently of any provider (formatter, linter) and impose zero performance penalty when the setting is left disabled (the default).
The MetricsLogger efficiently subscribes to VS Code configuration changes to cache its enabled state.
This ensures logging operations remain strictly allocation-light and avoid synchronous IPC overhead during hot paths.
To ensure long-term stability across rapid configuration changes and Extension Host test runs, all telemetry and diagnostic loggers formally track their own lifecycles via the extension context. This guarantees zero-overhead cleanup and strict state isolation when deactivated or reset.
Performance Troubleshooting
If you experience high CPU usage or delayed IntelliSense in massive monorepos, check the following:
- Verify your Ignored Globs: Ensure your
gherkinPowerTools.behave.ignoreGlobscorrectly exclude virtual environments,node_modules, and compiled assets. If the extension attempts to parse thousands of third-party Python files inside a virtual environment, performance will degrade. - Narrow your Step Globs: If your steps are isolated to specific directories (e.g.,
tests/features/steps), updategherkinPowerTools.behave.stepGlobsto strictly target those folders instead of scanning the entire workspace. - Run the Diagnostic Command: Execute
Gherkin PowerTools: Diagnose Workspacefrom the Command Palette. The generated report will tell you exactly how many step files are currently being tracked by the internal watchers. If this number is unexpectedly high (e.g., in the thousands), your globs are likely too permissive.